Retail and trade shows of all stripes are exciting, grueling, and informative. No other sort of event gives you instant insight into what your customers are thinking and buying. However, even with this fast feedback, it can be hard to quantitatively determine if your show was more successful than a different one, or whether it even paid for itself. Luckily, three simple equations can help anyone decide if that booth rental was worth it.
In this article, I’ll use a hypothetical example to show you how to calculate each number. For the purposes of this exercise, I’ve chosen a local yarn store that’s rented a booth at a fiber arts festival. They’ve brought an assortment of best-selling yarns, pattern books, and needles and sundries to sell. The owners want to figure out if they’ve made enough money to justify the booth price, whether they should attend again next year, and whether it was worth bringing all those plastic totes full of wool.
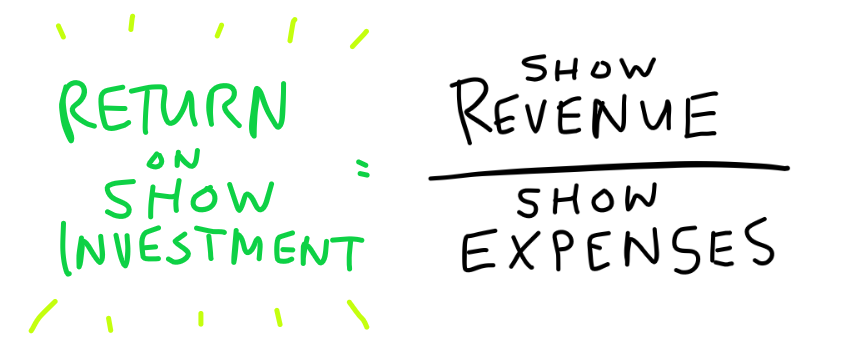
Return on Investment
Your ROI tells you by what percentage you grew the money you put into an activity. Imagine the money you spent on your trade show was seeds; now it’s now time to measure the harvest. To calculate return on investment, divide the money you made at the show by the money you spent to be there. Numbers over 1 (that is, 100%), mean you made more money than you invested. Obviously, this is a good thing.

Return on investment is useful for comparing shows of different sizes or expenses, since they level any differences in revenue or expense. It’s also useful for discerning whether you did better from one year to another.
Our fictional yarn shop spent $775 on booth rental, staff wages, and staff meals at the fiber arts festival. They made $3,037 in revenue. Their return on investment is 3.92, or 392%, which means they made almost four times as much as they put into the event. Other factors might affect whether or not they return next year, but they know for sure the show turned a profit.
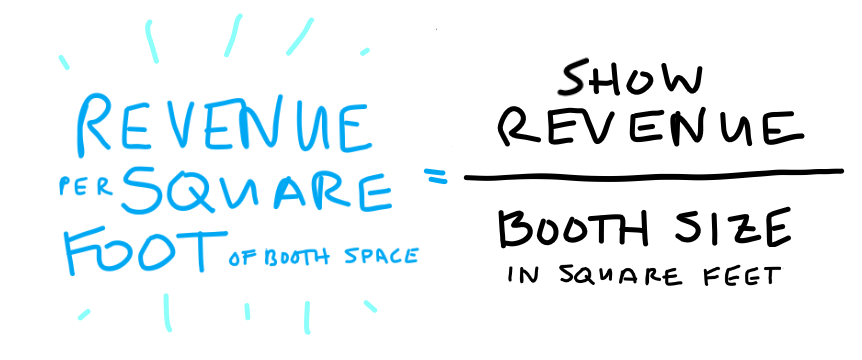
Revenue per Square Foot / Gross Margin per Square Foot
A revenue per square foot calculation distributes the amount you made at the farmer’s market across the size of the space you rented. It helps you understand how well you utilized your space, and makes it easier to compare results from shows with different booth sizes. To calculate revenue per square foot, divide the total amount of money you brought in by the square footage of your booth space (which is length multiplied by depth).

Revenue per square foot also allows you to drill down to revenue (or gross margin*) per square foot to understand which products are making you the most money. If you do the purchasing or product planning for a trade show, retail show, craft fair, or farmer’s market, this calculation can help you understand what you should be bringing more of next time, and which products you can abandon.
To figure your product-level revenue per square foot, draw a plan of your booth layout. Next, calculate the square footage you are devoting to selling each category of products. Then, divide your revenue (or gross margin) for each product category by the square footage. Perhaps you’ll find you spent too much space on one thing or not enough on the other!
Gross margin per square foot is an excellent tool for comparing different products at one show or a single product at multiple shows. It’s also immensely useful for planning booth layout and product procurement going forward.
*Gross margin is revenue minus the cost of the product you sold. You can also think of it as the money you have left after paying for the thing you just sold.
The fictional yarn shop’s booth was 8×12 feet (so, 96 square feet). They sold $3,037 worth of product, and therefore made an average revenue per square foot of $31.64.
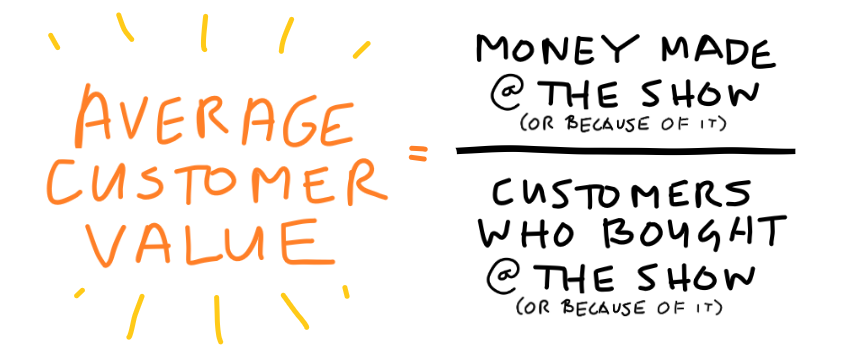
Average Customer Value
Your average customer value is the amount, on average, that your customers spend with you. In the simplest form, it’s calculated by your total show sales divided by the number of customers you sold to. You can also drill down by including sales that happen after a show but are still directly related to it.

If you collect email addresses at a show and those people later buy from your web store, it also becomes easy to see how much revenue, on average, those email addresses are worth. You can set goals based on that number, too. If you find that each email address you gather generates roughly $25 in sales at the show (or because of it), and you need to make $2500 in sales to pay for an event, you can balance your efforts between moving product and gathering contact information based on your staff’s comfort and skill level with each task. If you are attending a trade show, any sales you make by following up with distributor or wholesale customers can be attributed to the show where you last talked with them.
Our fictional yarn store brought in $3,037 in revenue with 122 customers over the course of the show. Their average customer value was $24.89.
If your average customer value seems low, don’t despair. A disappointing average customer value can signal an opportunity to increase your conversion rate, order size, or buying frequency. How could you tweak your booth presence to encourage repeat shoppers over the course of an event? Would rearranging your products encourage impulse or add-on purchases?
So often, gut feelings and total sales are a retail show’s only benchmarks for success. While high-level conclusions are important, these three simple formulas can work overtime to bring you actionable insights and repeatable successes. The next time you go to a trade show, retail show, craft fair, or farmer’s market, take an hour or so to measure your results afterward. The areas for improvement might surprise you — and you’ll know for sure if it all was worth it.
Interested in making your next show the best it can be? Whisk and Blend is happy to help with sell sheet/catalog design, trade show planning, and more. Browse our list of services or reach out to discuss your plans.
